MUHAMMAD SAFDAR / APPLIED AI & ML
Eight projects. Original analytical dashboards.
Explore the supplied collective dashboards, with full-size charts, model comparisons and error analysis. Figures below are transcribed from these screenshots, rather than newly computed benchmarks.
Sonar Signal Classification
Accuracy 81.0% · ROC AUC 0.939 · Average precision 0.950
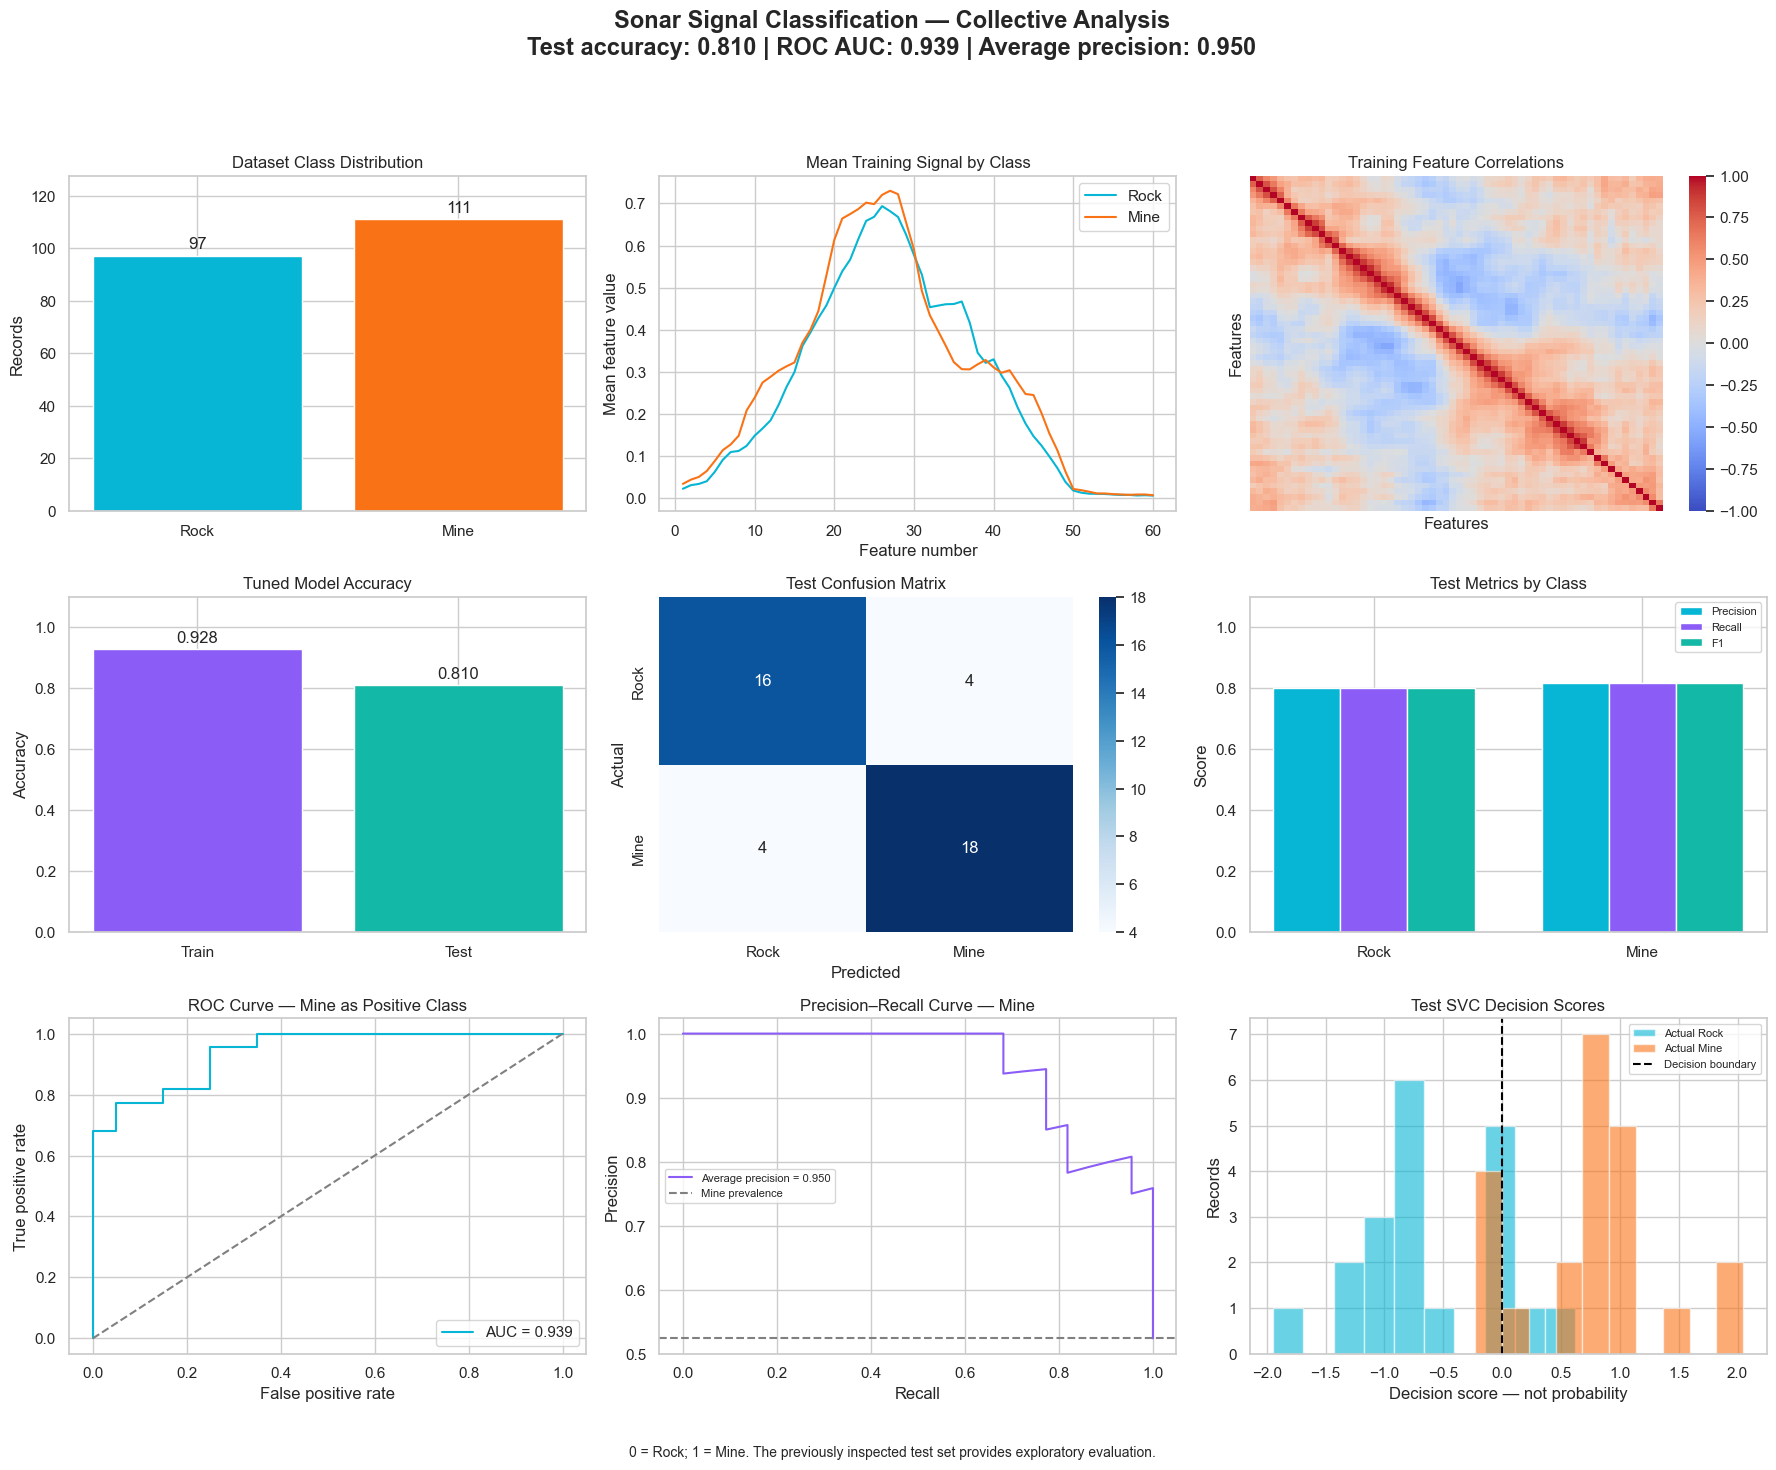
Supplied tuned SVC dashboard; 42 test samples. This run differs from the earlier baseline evaluation.
Breast Cancer Classification
Accuracy 96.5% · Malignant recall 92.9% · ROC AUC 0.990
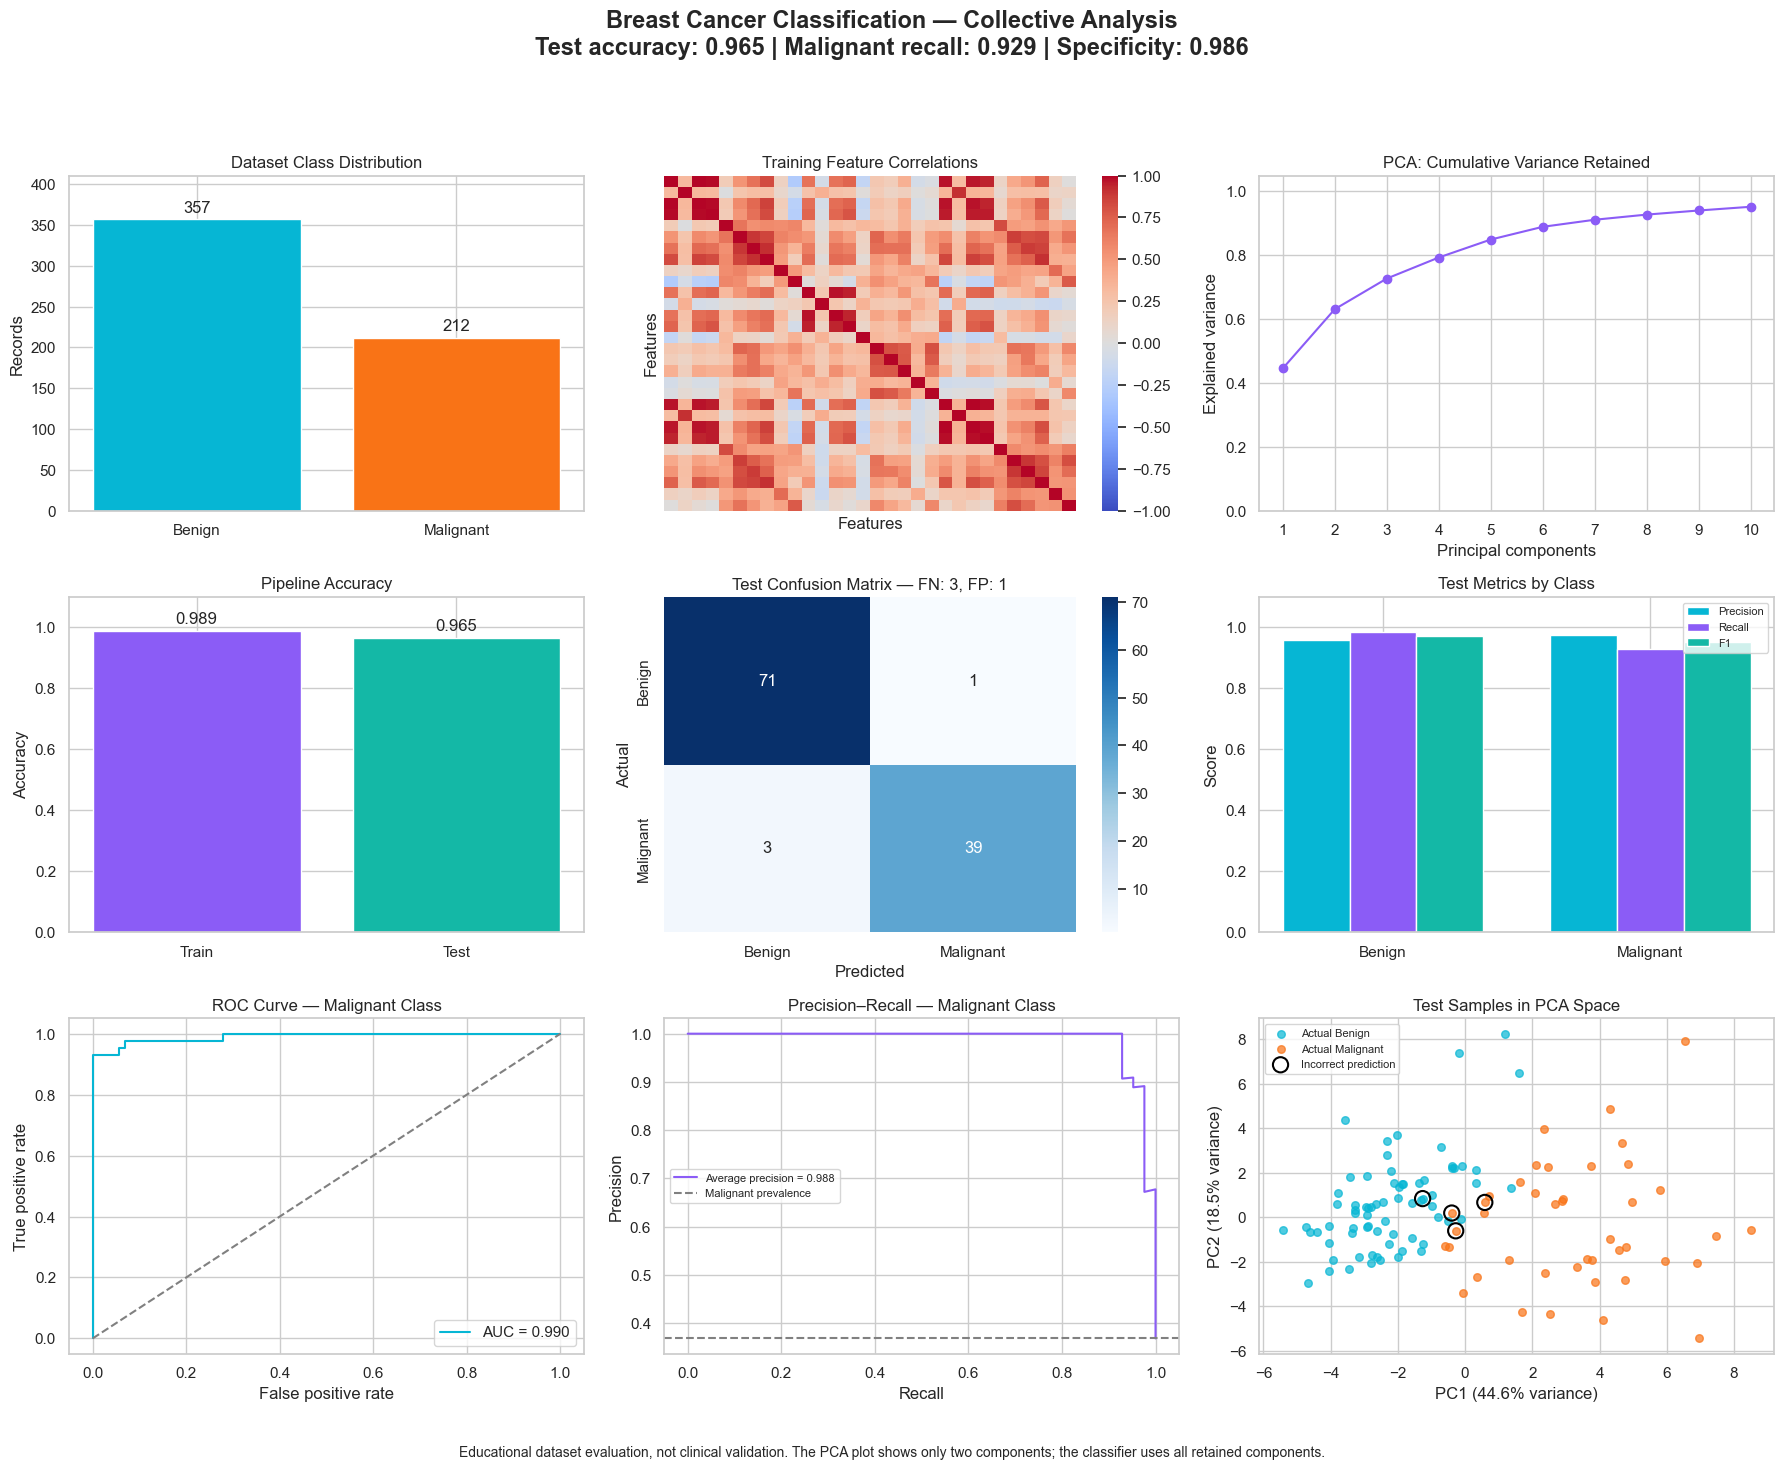
Educational dataset evaluation; 3 missed malignant cases and 1 false positive in the displayed test set.
Credit Card Fraud Detection
Fraud recall 83.7% · Precision 88.2% · Average precision 0.861
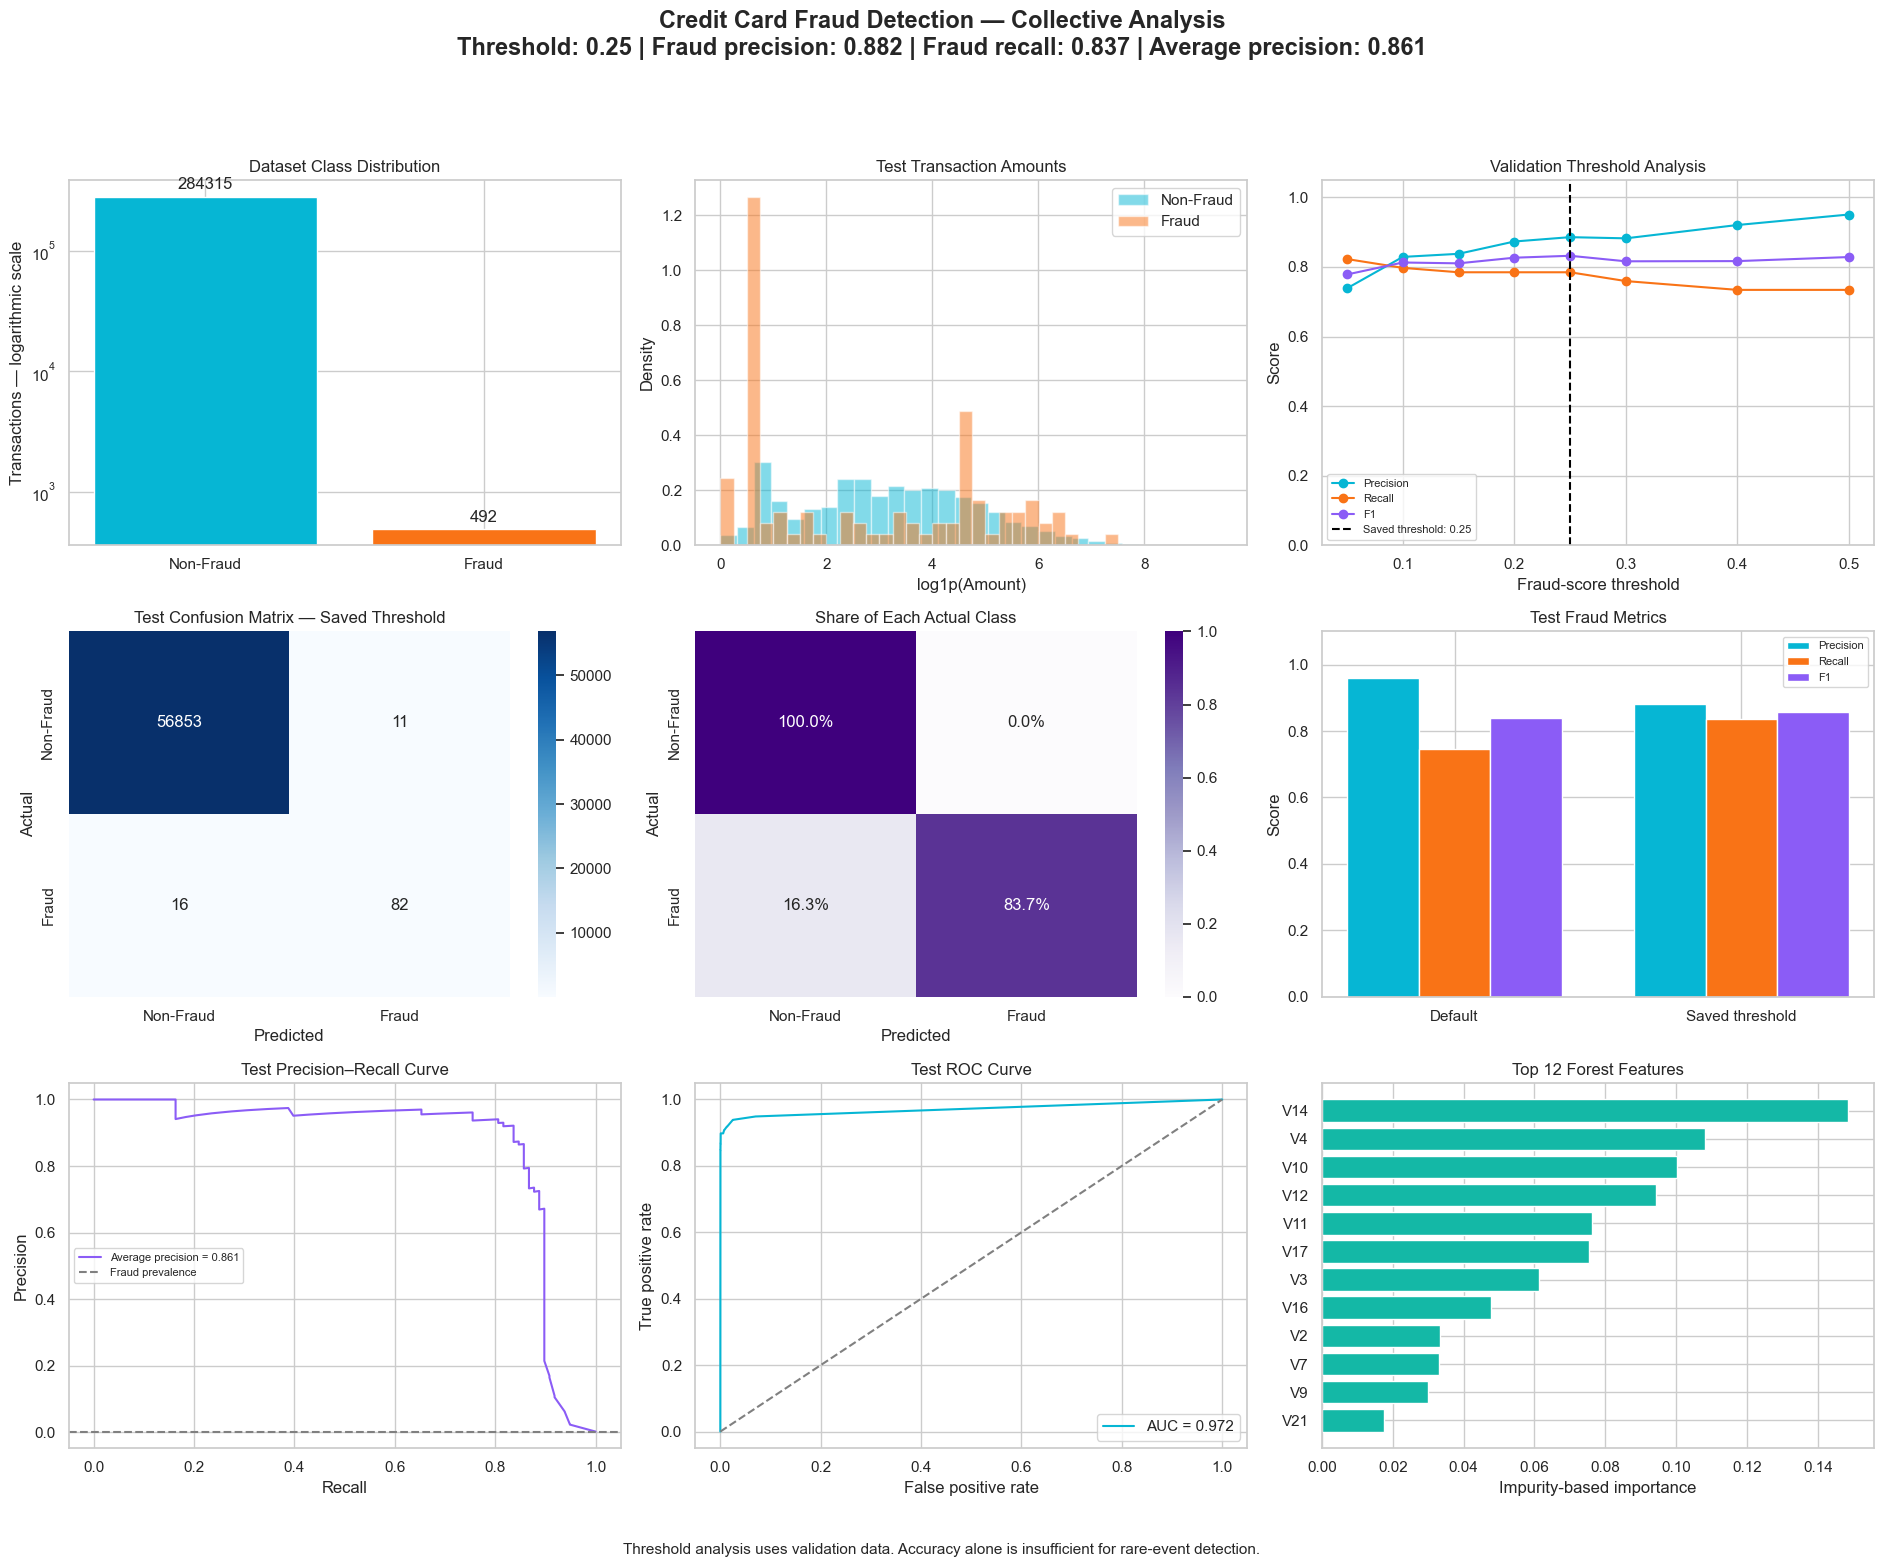
Supplied notebook run at threshold 0.25: 82 detected frauds, 16 missed frauds and 11 false alarms. This differs from the earlier duplicate-removed experiment.
House Price Prediction
MAE $30,846 · RMSE $46,504 · R² 0.835
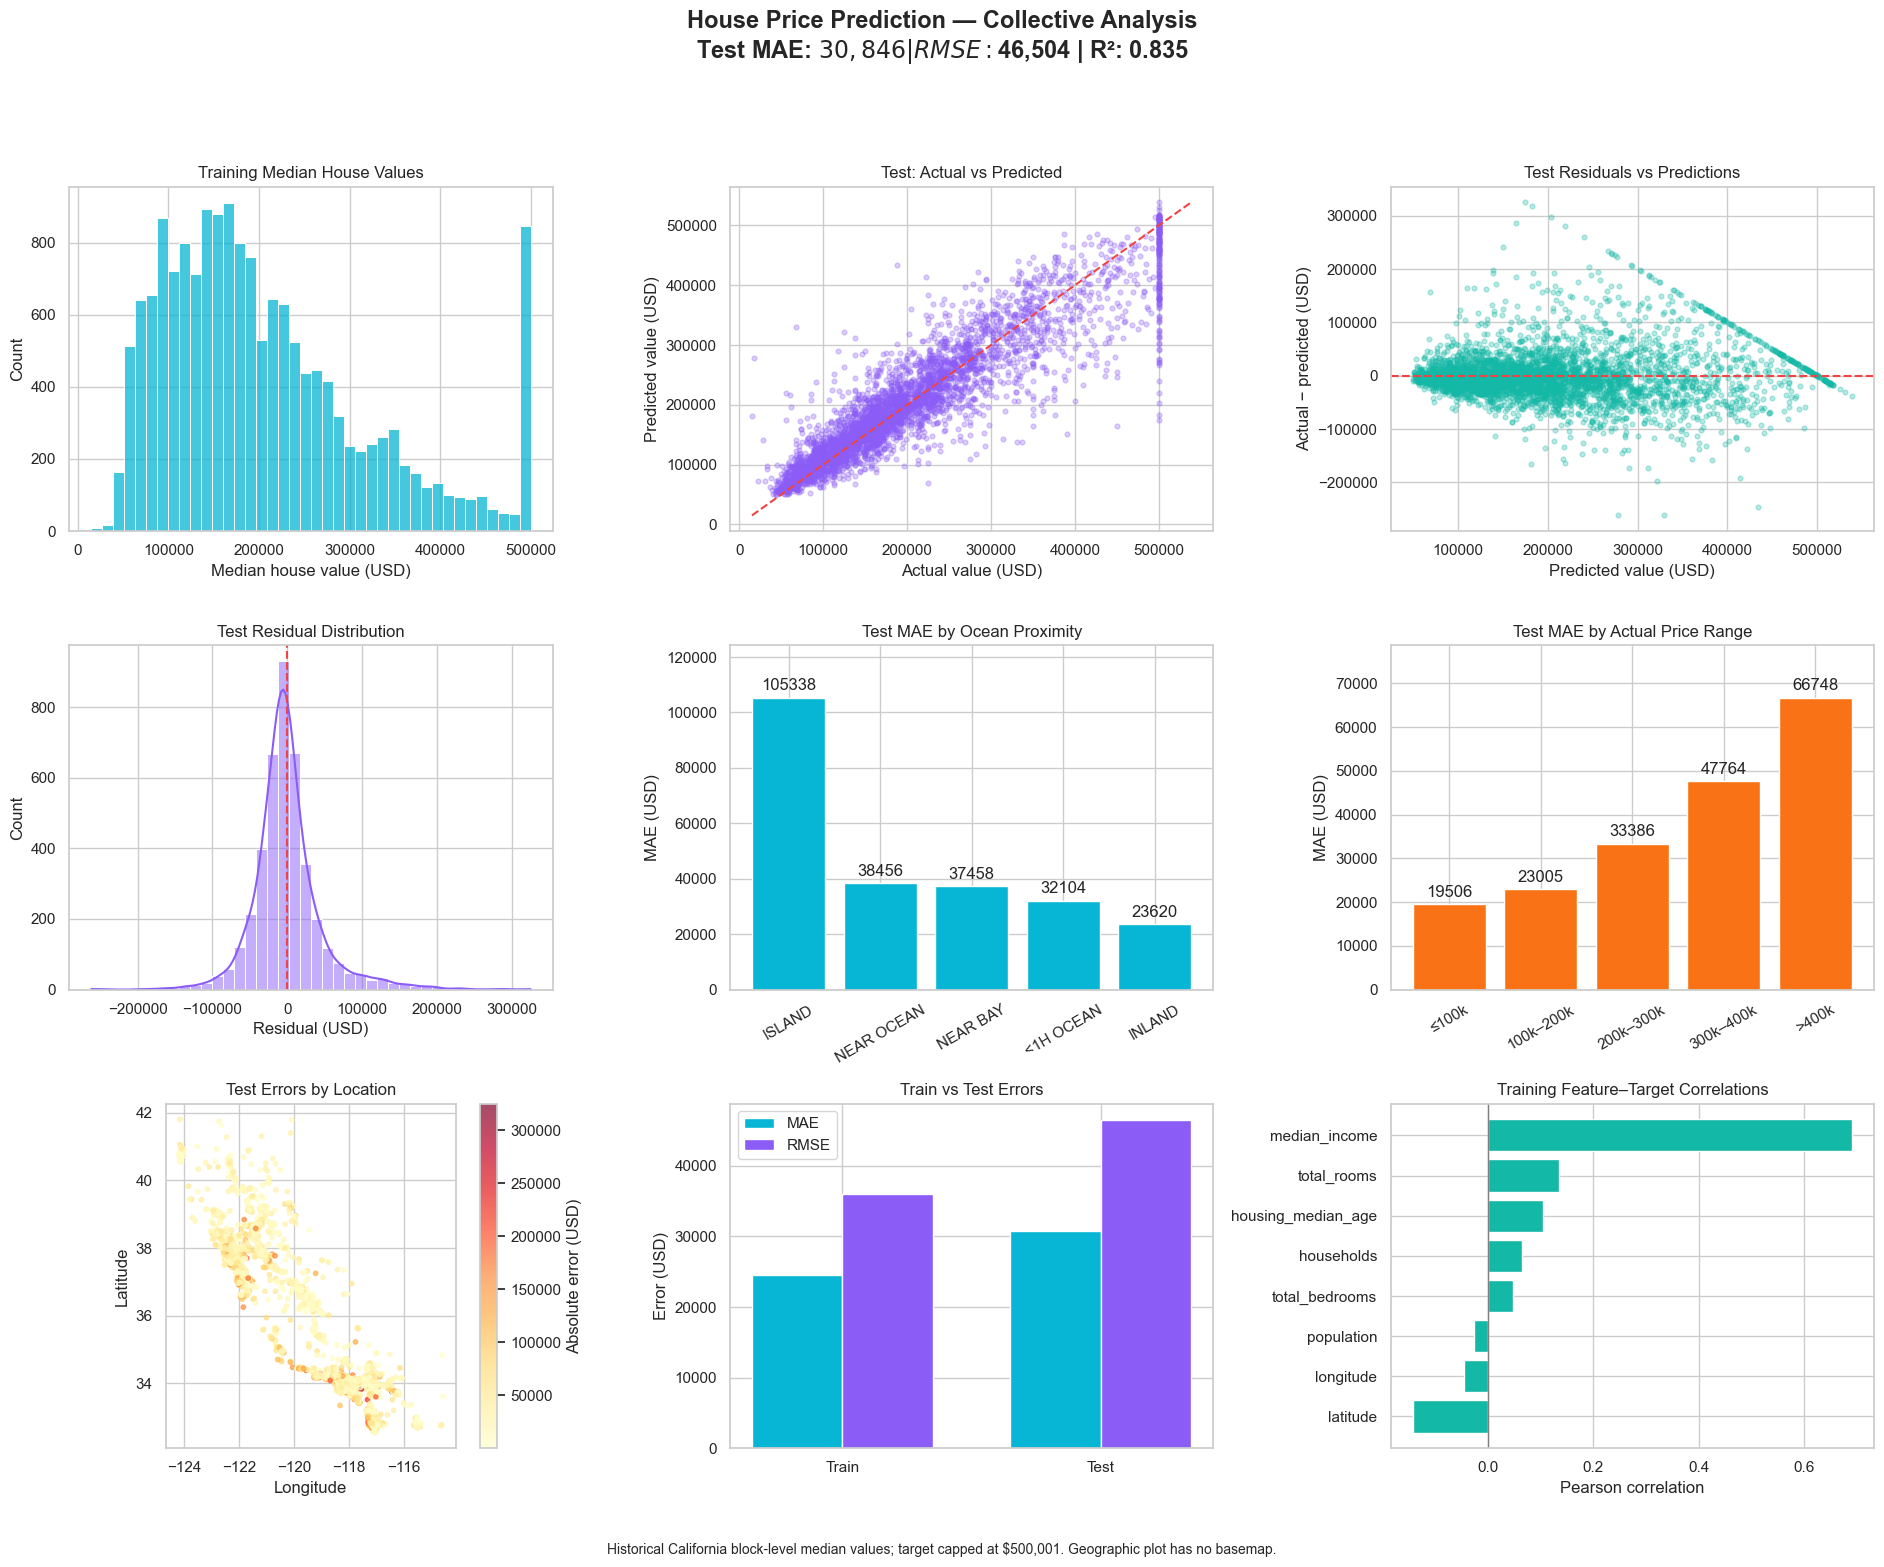
California housing evaluation with geographic and price-range error analysis.
Medical Insurance Cost Prediction
MAE 1,959.91 · RMSE 4,284.29 · R² 0.900
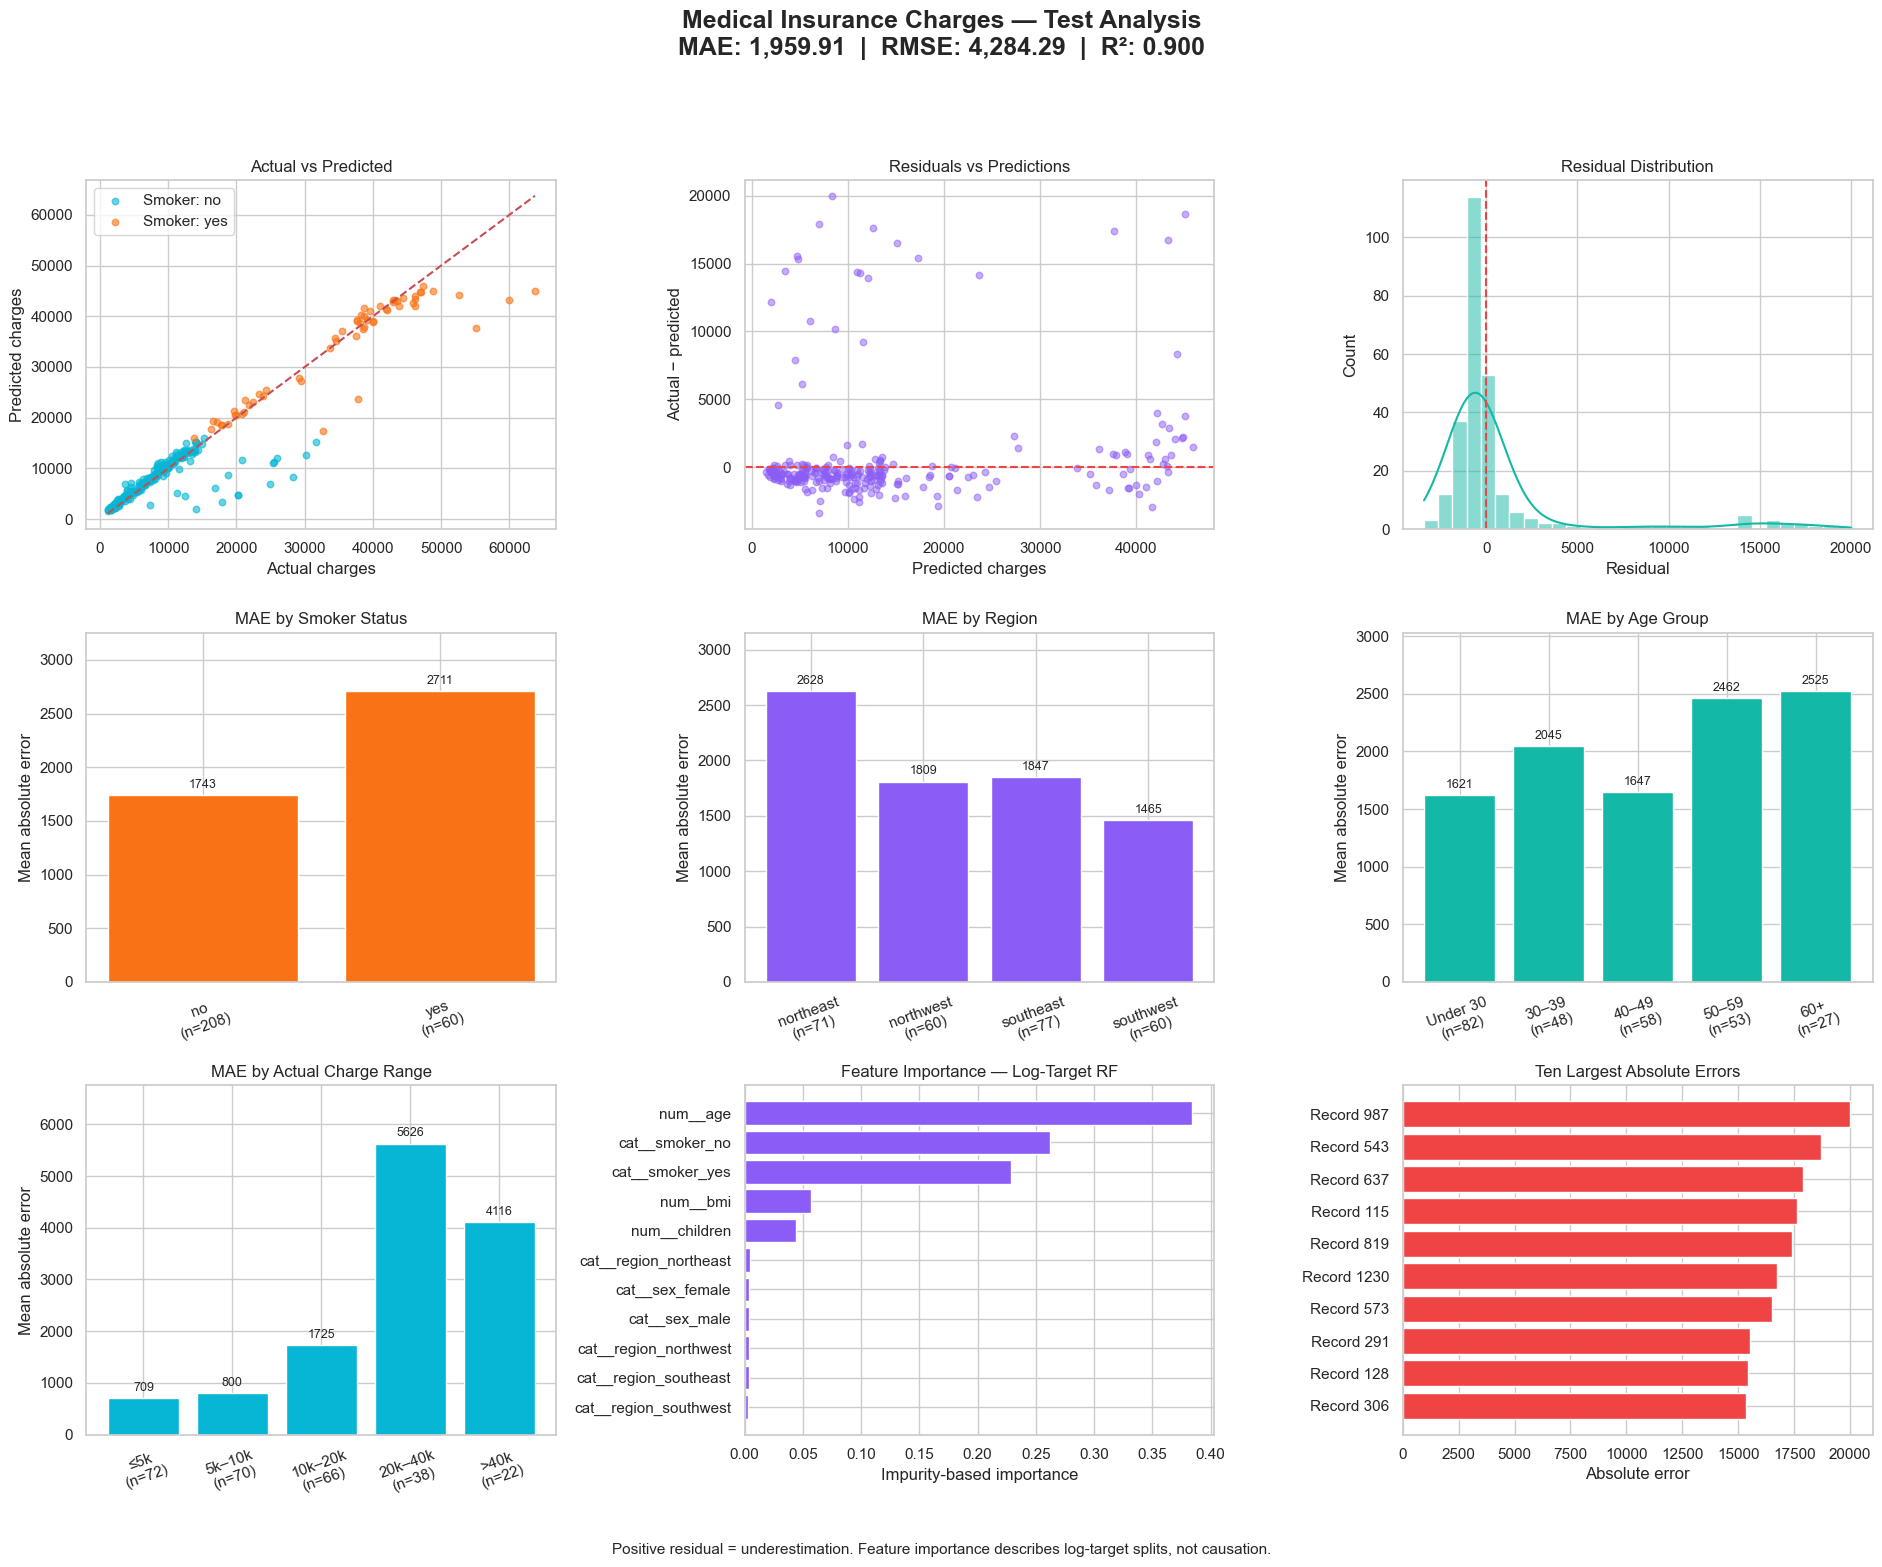
Log-target random-forest evaluation with subgroup errors and feature importance; educational estimates.
Customer Segmentation
200 customers · 5 clusters · Silhouette 0.555
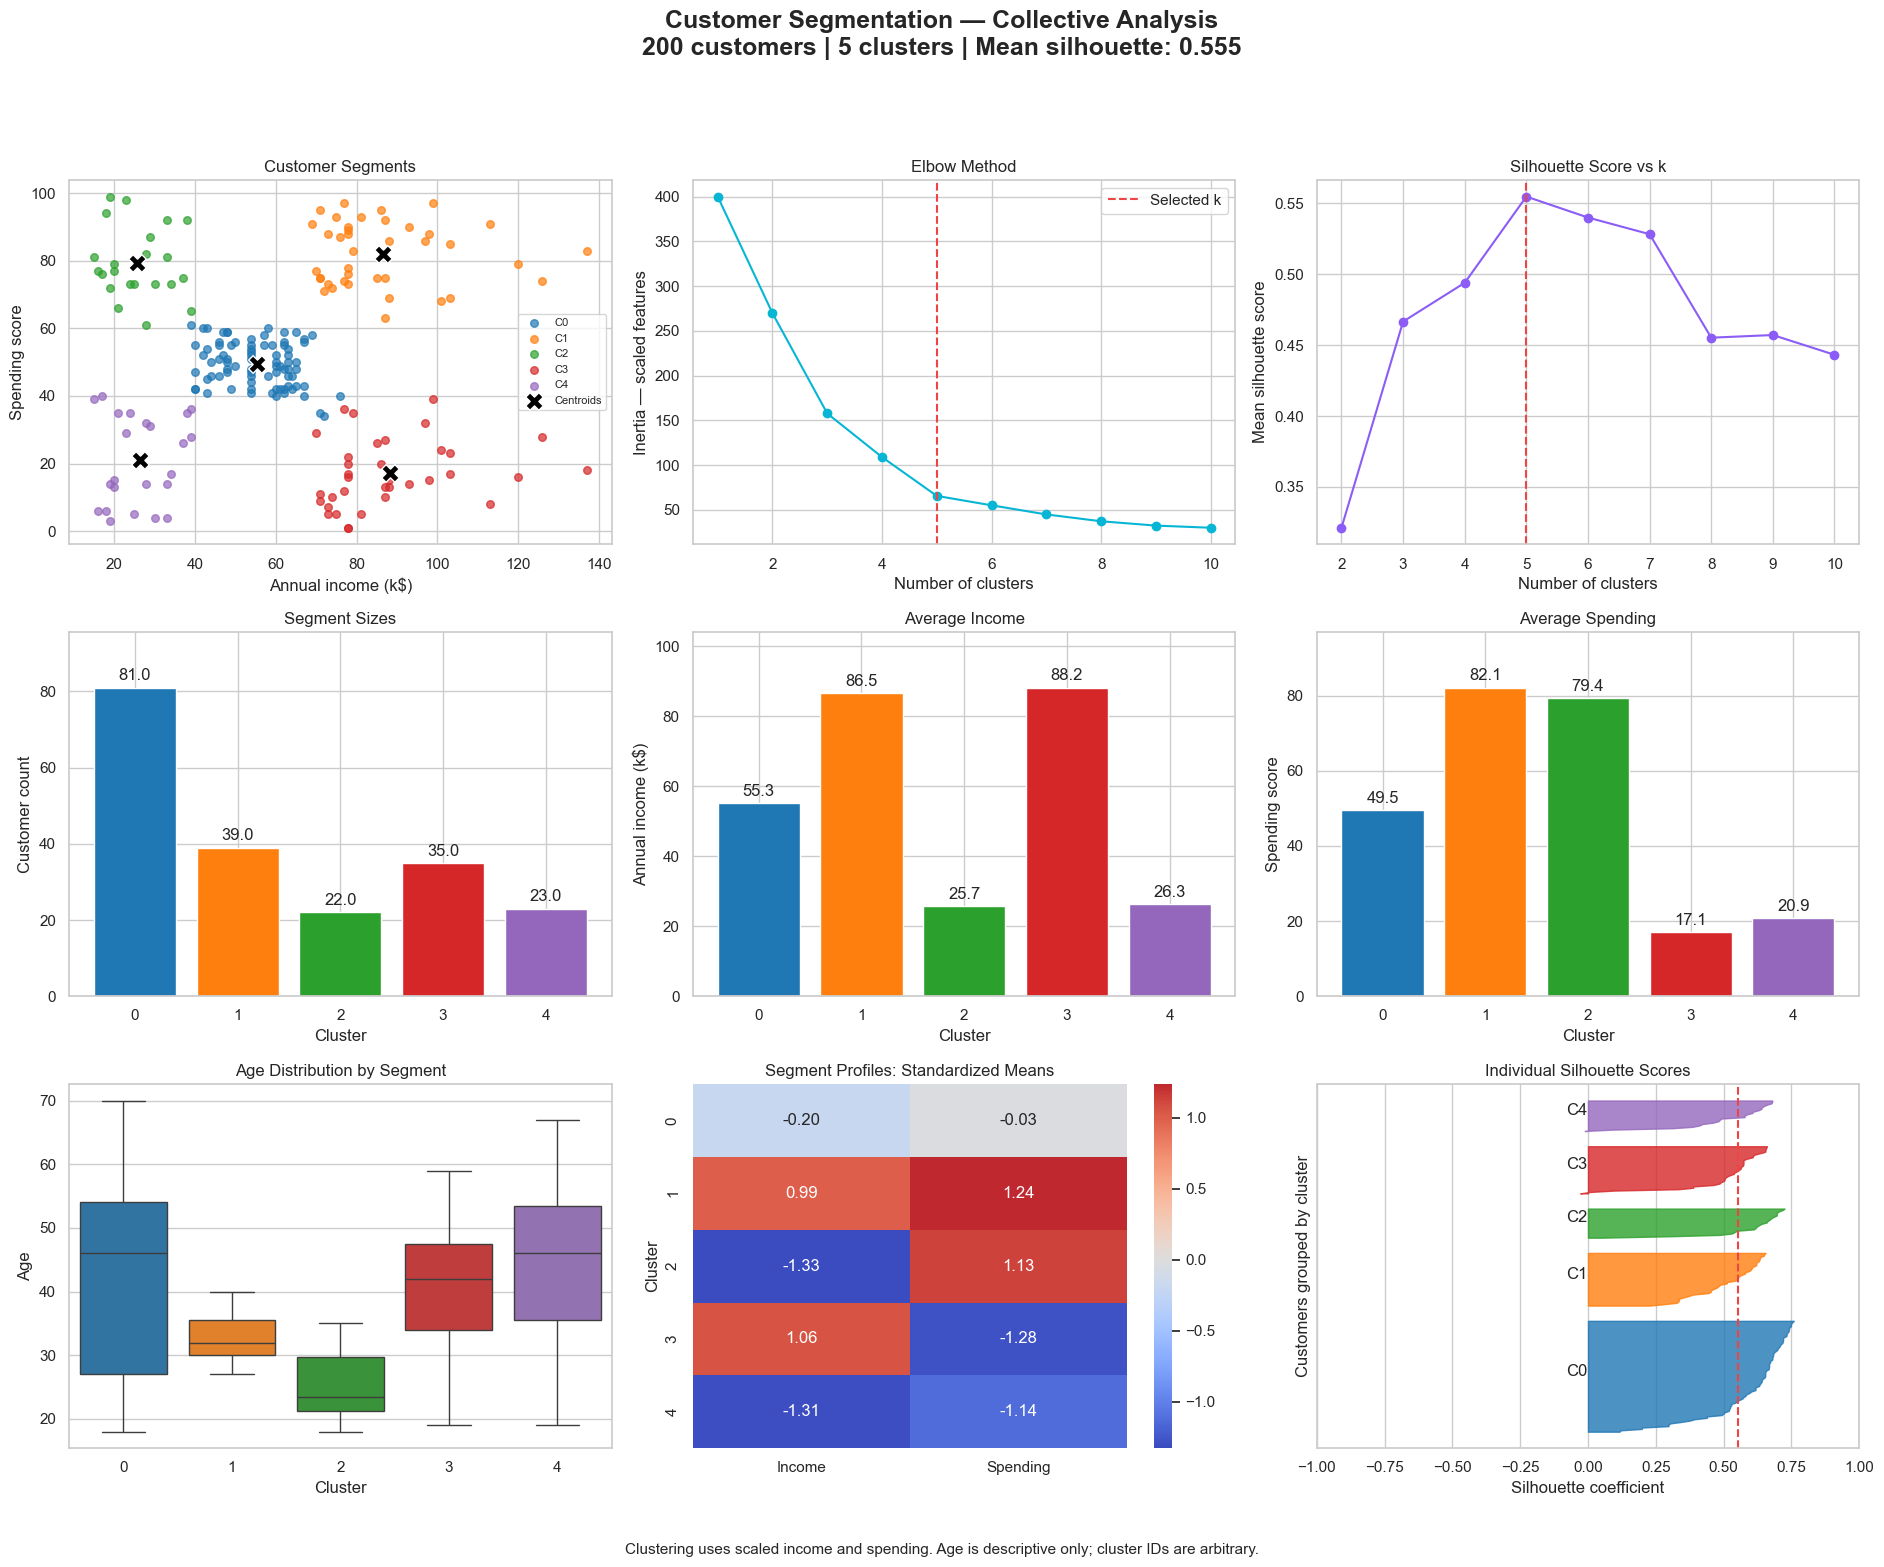
Customer profiles, cluster sizes, elbow and silhouette analysis; cluster IDs are arbitrary.
Fake News Text Classification
Accuracy 95.4% · Macro F1 0.954 · ROC AUC 0.991
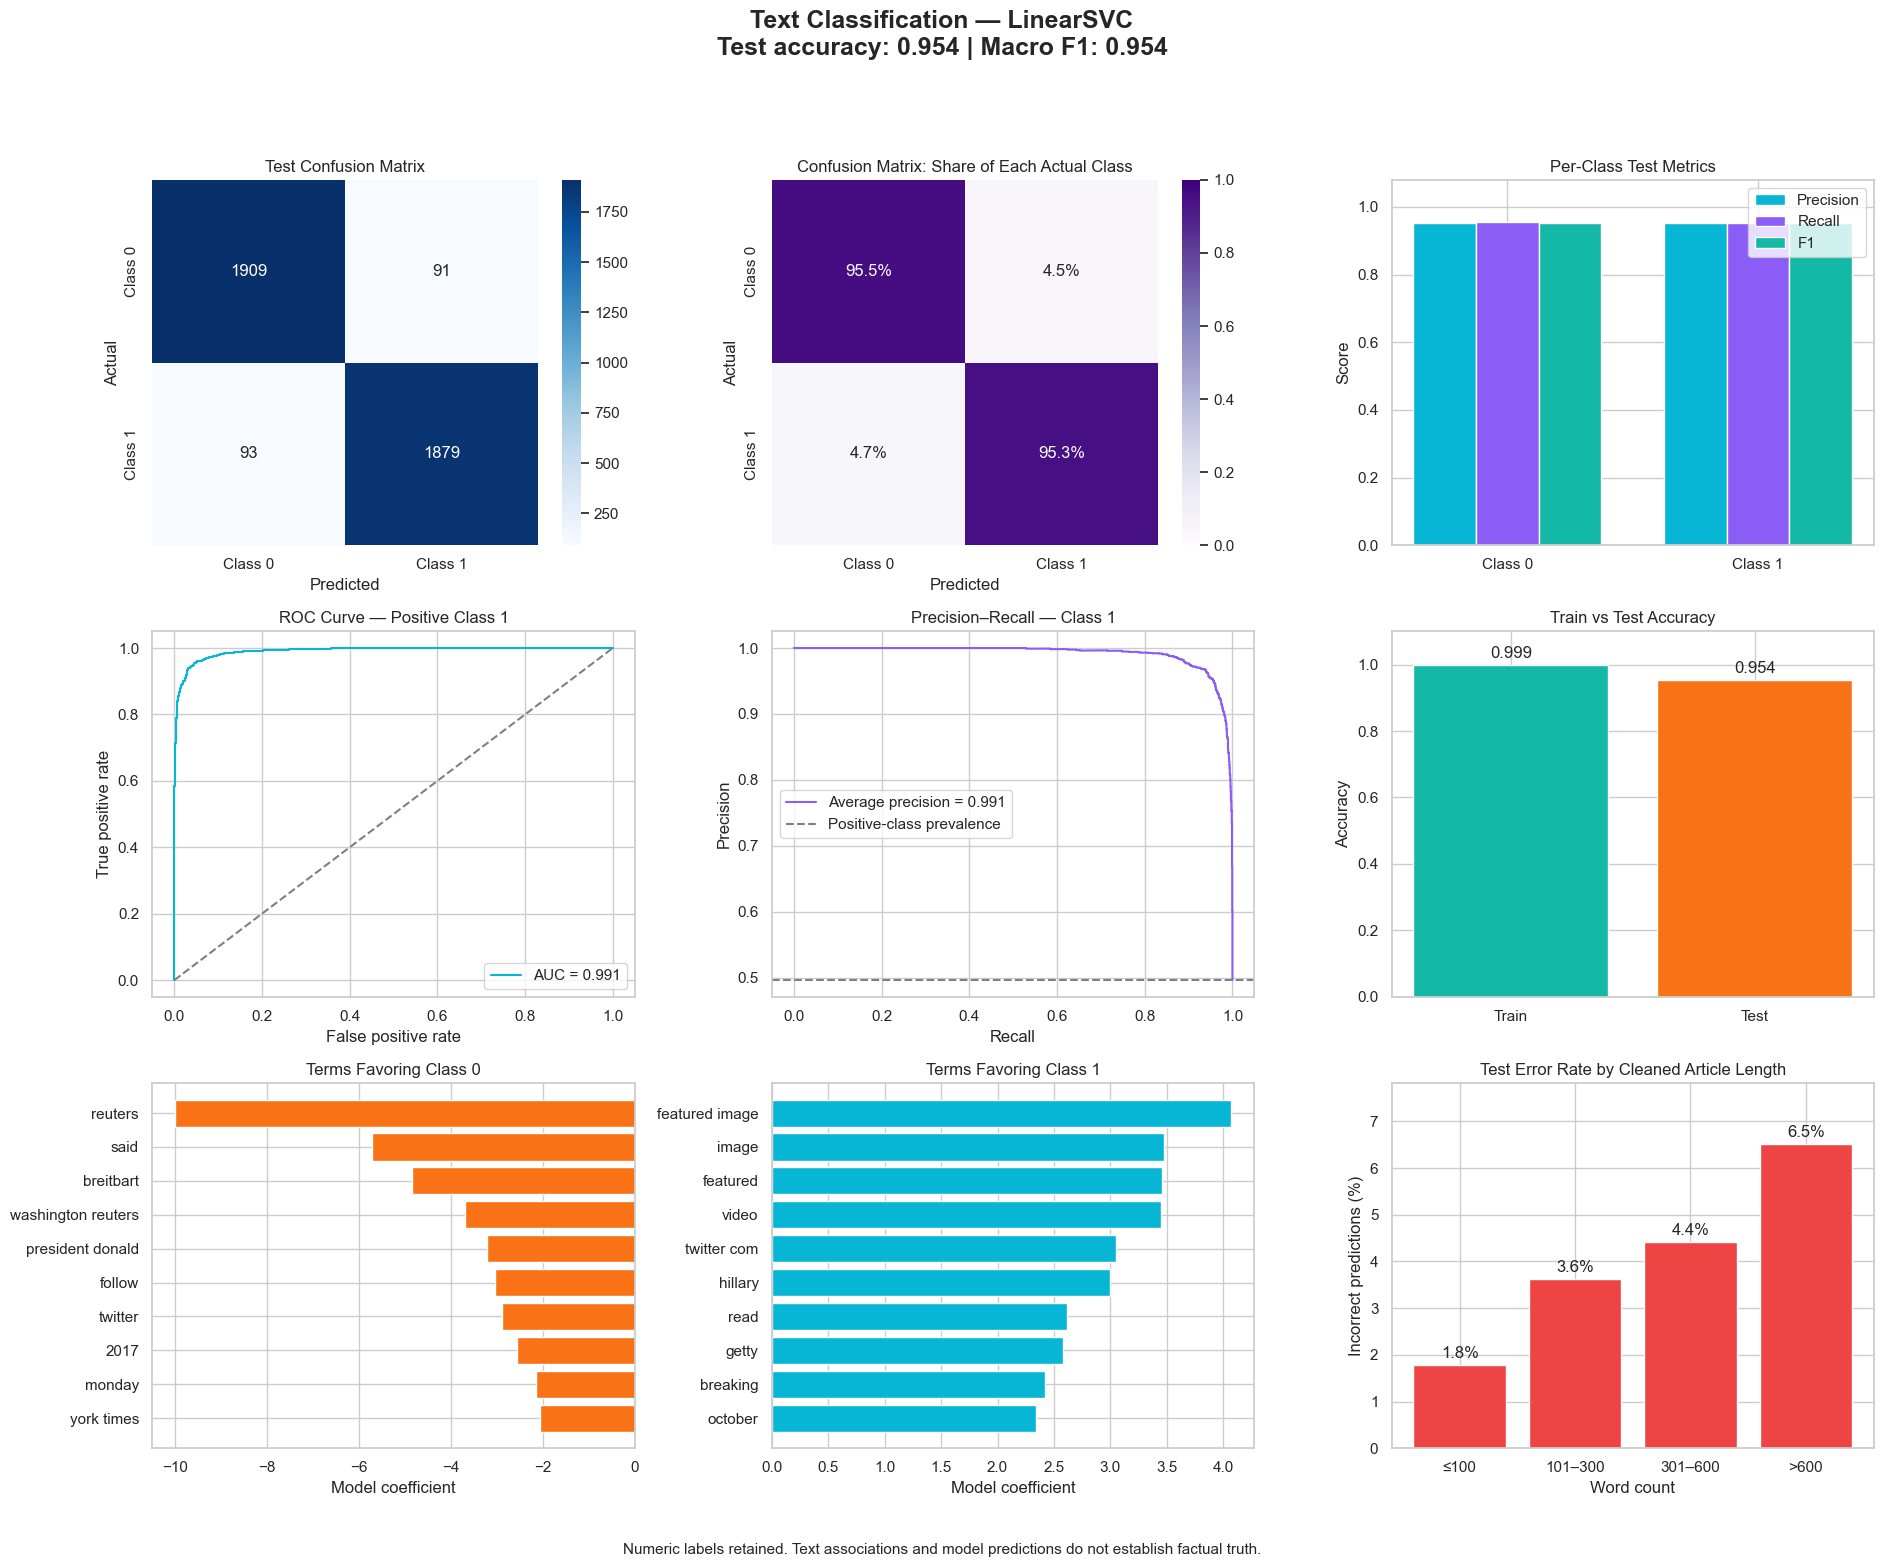
TF-IDF and LinearSVC evaluation, term weights and text-length errors. Numeric class labels are retained; this model does not verify factual truth.
Airline Passenger Forecasting
Log-SARIMAX RMSE 18.83 · Seasonal-naive RMSE 50.71 · ARIMA RMSE 86.81
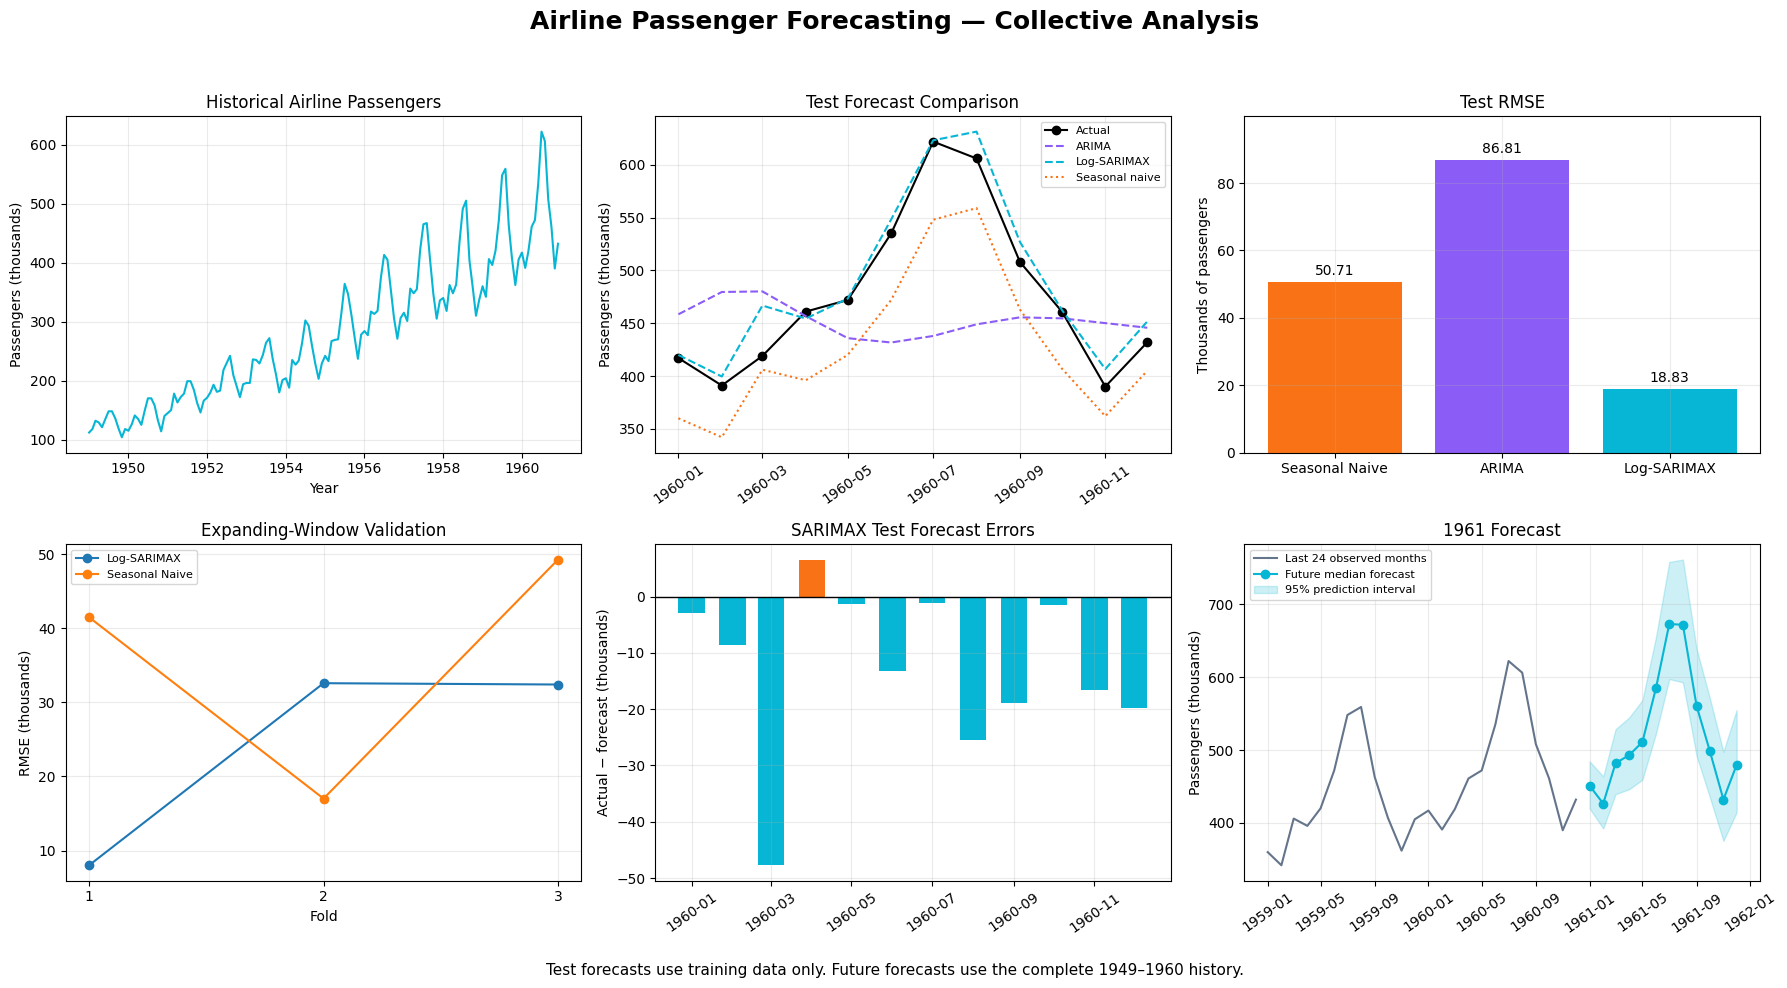
Historical passenger series, chronological validation, residuals and 1961 forecasts.